I have a daily note in Obsidian which I use to plan my day as well as track certain habits which I want to maintain.
I’ve found a good way of visualising this over the week is with a progress bar that shows how many days I’ve maintained that habit. To create these I’ve used the Dataview plugin for Obsidian which allows you to query and present data from your notes.
In this case I’ve used it to retrieve metadata stored in the YAML frontmatter of my daily notes:
---workout: truesteps: 5300read: false---Dataview allows you to query this using a JavaScript API or their built in SQL like query language called Dataview Query Language (DQL). DQL allows for querying as well as some basic data-visualisation such as creating lists, tables, and calendars. As in this instance I need to do some data manipulation and generate custom HTML I have gone with the JavaScript API.
Querying Data
To query data dataview gives access to a dv variable which can be used to query and render data within a note.
I can access all my daily notes by using dv.pages() and specifying the directory I want to query from:
dv.pages('"Journal"');I want to fetch all the metadata only for notes made this week. Since all my files are titled using a standardised date format (yyyy-mm-dd) I can use dv to retrieve the file name:
const currentFileName = dv.current().file.name;and from that use moment js calculate the start and end of the current week:
const weekEnd = moment(currentFileName, "YYYY-MM-DD");const weekStart = moment(weekEnd).startOf('week');I can now use these dates to filter my Journal entries:
const entries = dv.pages('"Journal"').filter(p => { const date = moment(p.file.name, "YYYY-MM-DD"); return date.isBetween(weekStart, weekEnd);});dv.pages() returns a data array which is an array that has been extended with extra functionality. The array contains the page objects each of which contains the fields defined in the YAML frontmatter of each note. From this I can then calculate how many days I have maintained my habit, in this case reading:
const readCount = entries.filter(p => p.read === true).length;Creating the Progress Bar
To create the progress bar itself I first define functions which will generate each element:
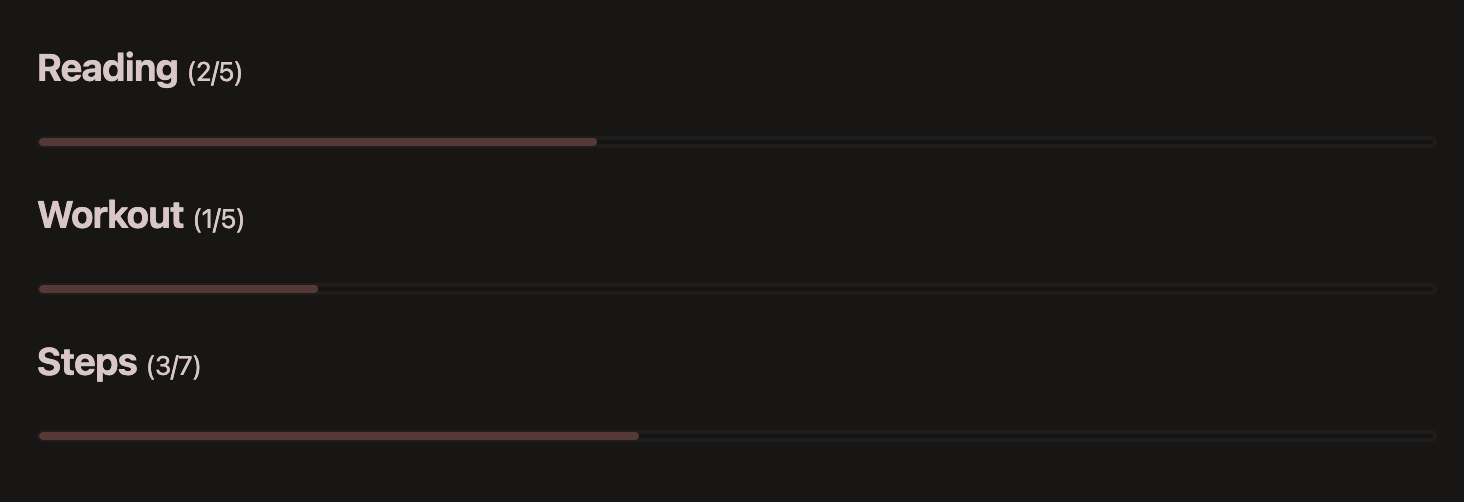
const progressLabel = (title, count, days) => `<h3>${title} <span style="font-size: 0.7em; font-weight: 400;">(${count}/${days})</span></h3>`;const progressBarElement = (count, total) => `<progress max=100 value=${Math.round((count / total) * 100)}></progress>`;and then a function to generate and append the elements to the DOM:
const createProgressSection = (title, count, days = 5) => { const progressBarSection = progressLabel(title, count, days) + progressBar(count, days); dv.el("div", progressBarSection, { cls: "progress-tracker" });};Then it is simple to create as many progress bars as I’d like for what ever I want to track
createProgressSection("Reading", readCount, 7);createProgressSection("Workout", workoutCount);createProgressSection("Steps", stepCount);And the result is: